Working with Data 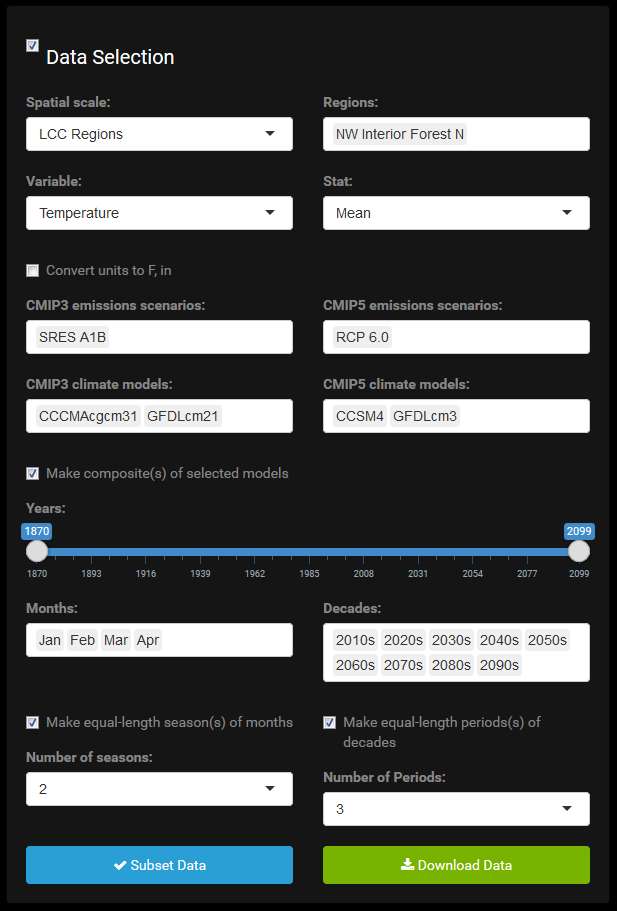
Returning to the data selection panel, how do we use it?
Variables
Several of the variables are categorical (climate models, emissions scenarios, geographic locations, etc.). Some are discrete numerical (months, years, decades). All of these serve in subsetting the primary data variables (temperature, precipitation) by way of selecting factor levels and ranges, respectively.
Going row by row, first is spatial scale, which is either cities/communities or different groups of broader geographic regions. To the right, specific geographic locations propagate. Next are the data variables, climate or ecological, currently climate only (temperature and precipitation) but to be expanded to include vegetation and fire data. To the right, a statistic is selected for the chosen variable. The statistic may summarize data for the variable across space when the variable is spatially explicit, e.g., temperature or precipitation; across simulations for already spatially aggregated data, e.g., fire frequency, burn area, vegetated area; or across both geographic space and simulation/modeling space, e.g., vegetation age. Just below is a checkbox for switching units of measurement. Metric is used by default.
Next emissions scenarios from CMIP3 and CMIP5, and below those, corresponding GCMs which SNAP has downscaled over Alaska and Western Canada. Then there is a checkbox for making composite models. If checked, the models chosen are averaged together.
Next is a slider allowing the user to restrict the years of the data subset. Months and decades follow. See Options Settings below for a description of the seasonal and multi-decade period options related to month and decade selection.
Data Requirements
This brings us to a discussion of requirements. What can and can’t be done with the data selection? Geographic locations propagate based on the spatial scale chosen. I have generally excluded the ability to make comparison plots of multiple locations that span large differences in spatial scale. You can expect they would look different, for example in terms of variability, and this is not the purpose of the app. Ecological variables (those currently slated for inclusion at least) are available only for regional locations and not for single community locations.
Months and decades are the only two menus which can be left blank. In all others, an empty menu means selections have not yet been made. Because months and decades are factors with a high number of levels, and often all levels are selected, it is tedious to have to check (or remove) them all. It also wastes space. For these two menus it is assumed the user wants all levels unless they specify a subset. The years of data returned are represented by the intersection of the years implied by the decades selection and the years implied by the years slider. This allows the user to use whichever is most convenient to restrict the data to the years they want. If you are looking for specific, discontinuous decades, use the decades menu. This is very common. Alternatively, albeit very unlikely, if you don’t want a full decade, cut into the ends of your decades selection with the years slider.
Regarding scenarios and models, the user must select at least one scenario and model from the same CMIP phase. For each of the models, there are model outputs from each of three scenarios. The scenarios are unique to each CMIP phase. Selecting only CMIP3 scenario(s) and CMIP5 model(s) or vice versa would return a data table with zero rows. Although the app provides the ability to select scenarios and models from both CMIP5 phases simultaneously and compare, this is not required. The user may elect to select from and explore GCM outputs from only one CMIP phase.
There are also sensible implicit restrictions when making a composite model, though these are more decisively imposed by me and not by the fact that it would generate an empty data table. When averaging GCMs together, averaging will only occur within a CMIP phase. The user cannot average CMIP3 models with CMIP5 models. If selecting only from one phase, the user may average any set of models, up to all five that are available.
The compositing does not average across scenarios if multiple scenarios are selected. Selecting four models and two scenarios would result in two four-model composite GCMs. However, if selecting models from both CMIP3 and CMIP5, it is not enough that averaging between phases be prohibited. It is also the case that the same number of individual GCMs must constitute the composite models from each phase. The user cannot make a composite model from two CMIP3 GCMs and another from five CMIP5 GCMs and then compare them when graphing. If the composite model checkbox is checked and unequal numbers of models have been selected from each CMIP phase, the averaging is simply ignored, which is evident in the resulting data table.
Optional Settings
Additional data selection options which are not required include defining seasons and multi-decade periods. Since these are optional they are hidden from view unless they become applicable based on user selections of months and decades. Although months and decades are each assumed to be the full set if none are individually selected from their respective menus, seasonal and multi-decade specifications each require that the user explicitly select months and decades, respectively. If only one month or one decade are explicitly selected, seasonal and multi-decade aggregation remain unavailable because there is nothing to aggregate yet.
If the user explicitly selects two or more consecutive months, a checkbox appears for making equal-length seasons from the selected months. By default it is unchecked. Once checked, a selection menu appears offering the possible number of equal-length seasons which can be defined based on the selected months. One-month seasons are disallowed because they are trivial and change nothing. Any other whole number factor will appear in the menu. For example, if six consecutive months are selected, the options include aggregating to three 2-month seasons, two 3-month seasons, or one 6-month season. If a month is added to the list, bring the total months to seven, the number of seasons available will drop to only the one 7-month season. The rules are similar with respect to multi-decade periods.
If the months or decades selected are not all consecutive (e.g., January, February, and July, or 1950s, 1960s, 1990s, and 2000s), each continuous subset is checked separately. If each continuous subset is not of equal length, aggregation is not allowed and the option to combine selections does not display. For equal-length subsets, the number of equal-length seasons available to choose from is based on the individual subsets, not the entire selection. This ensures no overlapping of data which are not included, e.g., in the example above, calling a multi-decade period “1950s-2000s”. In this example two 20-year periods can be defined, but a single 40-year period cannot.
Generating a Data Subset
In order to generate a data subset the user must fill in all selection criteria at least minimally. This means at least one of the two climate variables, at least one corresponding scenario-model pair from a single CMIP phase, a valid date range, and at least one location. Although the user may continue to select multiple climate variables, phases, scenarios, models, months, years, and locations, as soon as the minimal criteria are met, a Subset Data button will appear at the bottom left corner of the data selection panel. It will not be made available if insufficient information has been provided to generate a valid subset of data.
When this button is pressed, the app subsets the original data table and returns only what the user has requested. At this time a header of the first several rows of the data table will display to the right indicating successful completion. There is also a progress bar in the upper right corner of the browser. Also at this time, now that the data subset is available, the plot options panel appears below the data selection panel. The data selection panel not being needed any longer, automatically minimizes, and this makes more room for the plot options panel and helps to keep it alongside the plot. The user can expand the data selection panel and make changes to their data at any time.
Data Tables 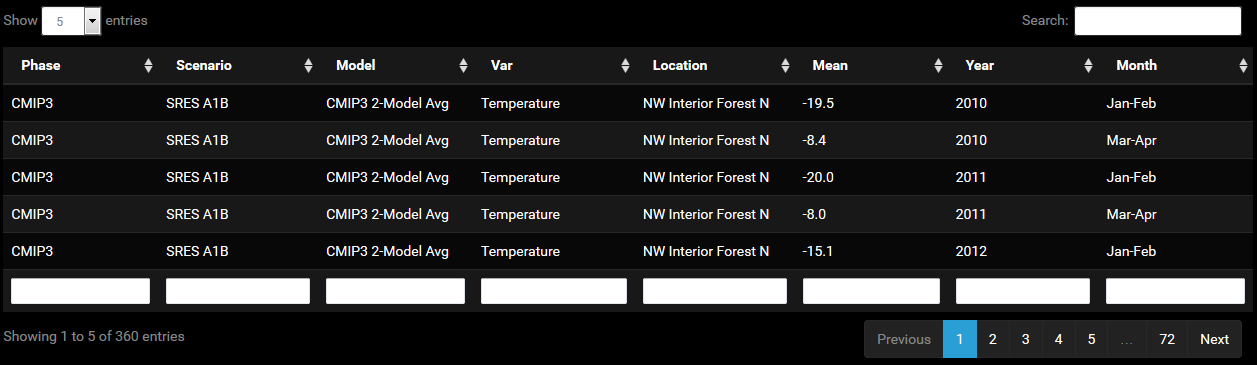
The data tables do not offer much direct use. They are also not very exciting when juxtaposed with aesthetically pleasing graphics that can also be remade in novel, seemingly endless, ways. One could argue that they are simply in the way. However, if you do a lot of quality control on data, you will understand that there is much to be said for dumping a little of it on the page and providing the option to query it directly. I take some comfort in knowing that the plot I make is actually of the data that I think it is, and that things are working as they should. It would be bad to graph the wrong data subset due to a bug in the code. Nothing in the plot really tells you that you have the right data.
Downloading Data
Once the Subset Data button is pressed, another element to appear is the adjacent Download Data button. This allows the user to download the data subset as a CSV file.