JFSP fire management treatments
2018-03-05
This short vignette provides a contextualized example of usage of fire size and FMO functions from the alfresco package, specifically fsdf and fmo_cb_reduction. See the help documentation for these and other associated functions for details.
Cumulative burn reduction results are compared for different fire management scenarios applied to multiple historical JFSP ALFRESCO model runs. Results are based on a two-factor experimental design. Each factor has a control and three treatment levels covering zero, 25, 50 and 75 percent maximum suppression applied to ALFRESCO fire sensitivity and ignition factor input maps, respectively. The status quo fire management scenario involves both controls: no suppression applied to either input map.
Setup
Load the required packages.
library(alfresco)
library(dplyr)
library(ggplot2)
Then prepare the data from the historical_fsv.rds file. After using fsdf and fmo_cb_reduction, make some additional changes in a new data frame for better plotting.
file <- "C:/github/jfsp/data-raw/historical_fsv.rds"
d <- fsdf(file)
d2 <- fmo_cb_reduction(d)

lev <- c("Control", "Tx: 50s/75i")
dex <- select(d, 7:10) %>% filter(FMO %in% c("fmo00s00i", "fmo50s75i")) %>%
    mutate(FMO = factor(ifelse(FMO == "fmo00s00i", lev[1], lev[2]), levels = lev),
        FS = FS/1000, CBA = CBA/1000)
Results
Table 1. shows results from all treatments. Below, figure 1. shows a comparison of one selected treatment with the control. In table 1., The % Sensitivity and % ignition show the treatment factors. These refer to the maximum percentage suppression applied to the ALFRESCO fire sensitivity and ignition factor input maps. For example, 25% sensitivity means that regions of the fire sensitivity map experienced no greater than 25% reduction in sensitivity for the model run.
The following mean, lower and upper percent change columns describe the mean and associated lower and upper bounds for the percent change from the status quo control run for a given fire management treatment level. These correspond to the last three columns of cumulative burn area means and minimum and maximum bounds across 32 ALFRESCO simulations. The period for comparison of treatments is 1950 - 2013.
| % Sensitivity | % Ignition | Lower % Change | Mean % Change | Upper % Change | Min Area | Mean Area | Max Area |
|---|---|---|---|---|---|---|---|
| No sensitivity suppression | |||||||
| 0 | 0 | -4.6 | 0.0 | 5.2 | 140,030 | 146,851 | 154,438 |
| 0 | 25 | -9.2 | -3.4 | 8.8 | 133,270 | 141,816 | 159,821 |
| 0 | 50 | -15.4 | -7.2 | 2.8 | 124,180 | 136,289 | 151,021 |
| 0 | 75 | -19.1 | -10.9 | -2.1 | 118,855 | 130,791 | 143,750 |
| Max 25% sensitivity suppression | |||||||
| 25 | 0 | -15.7 | -10.7 | -2.5 | 123,730 | 131,184 | 143,250 |
| 25 | 25 | -19.7 | -13.1 | -7.0 | 117,976 | 127,619 | 136,627 |
| 25 | 50 | -22.7 | -15.4 | -3.7 | 113,460 | 124,207 | 141,398 |
| 25 | 75 | -25.9 | -18.1 | -8.5 | 108,792 | 120,261 | 134,396 |
| Max 50% sensitivity suppression | |||||||
| 50 | 0 | -26.6 | -20.0 | -11.3 | 107,721 | 117,505 | 130,213 |
| 50 | 25 | -26.1 | -21.2 | -15.2 | 108,545 | 115,736 | 124,487 |
| 50 | 50 | -32.6 | -23.6 | -14.4 | 98,930 | 112,224 | 125,763 |
| 50 | 75 | -35.8 | -26.6 | -14.9 | 94,275 | 107,790 | 124,966 |
| Max 75% sensitivity suppression | |||||||
| 75 | 0 | -72.6 | -69.1 | -66.1 | 40,182 | 45,331 | 49,775 |
| 75 | 25 | -75.9 | -71.6 | -68.0 | 35,390 | 41,664 | 47,062 |
| 75 | 50 | -77.2 | -74.2 | -70.2 | 33,542 | 37,957 | 43,771 |
| 75 | 75 | -80.9 | -77.0 | -73.5 | 28,067 | 33,766 | 38,871 |
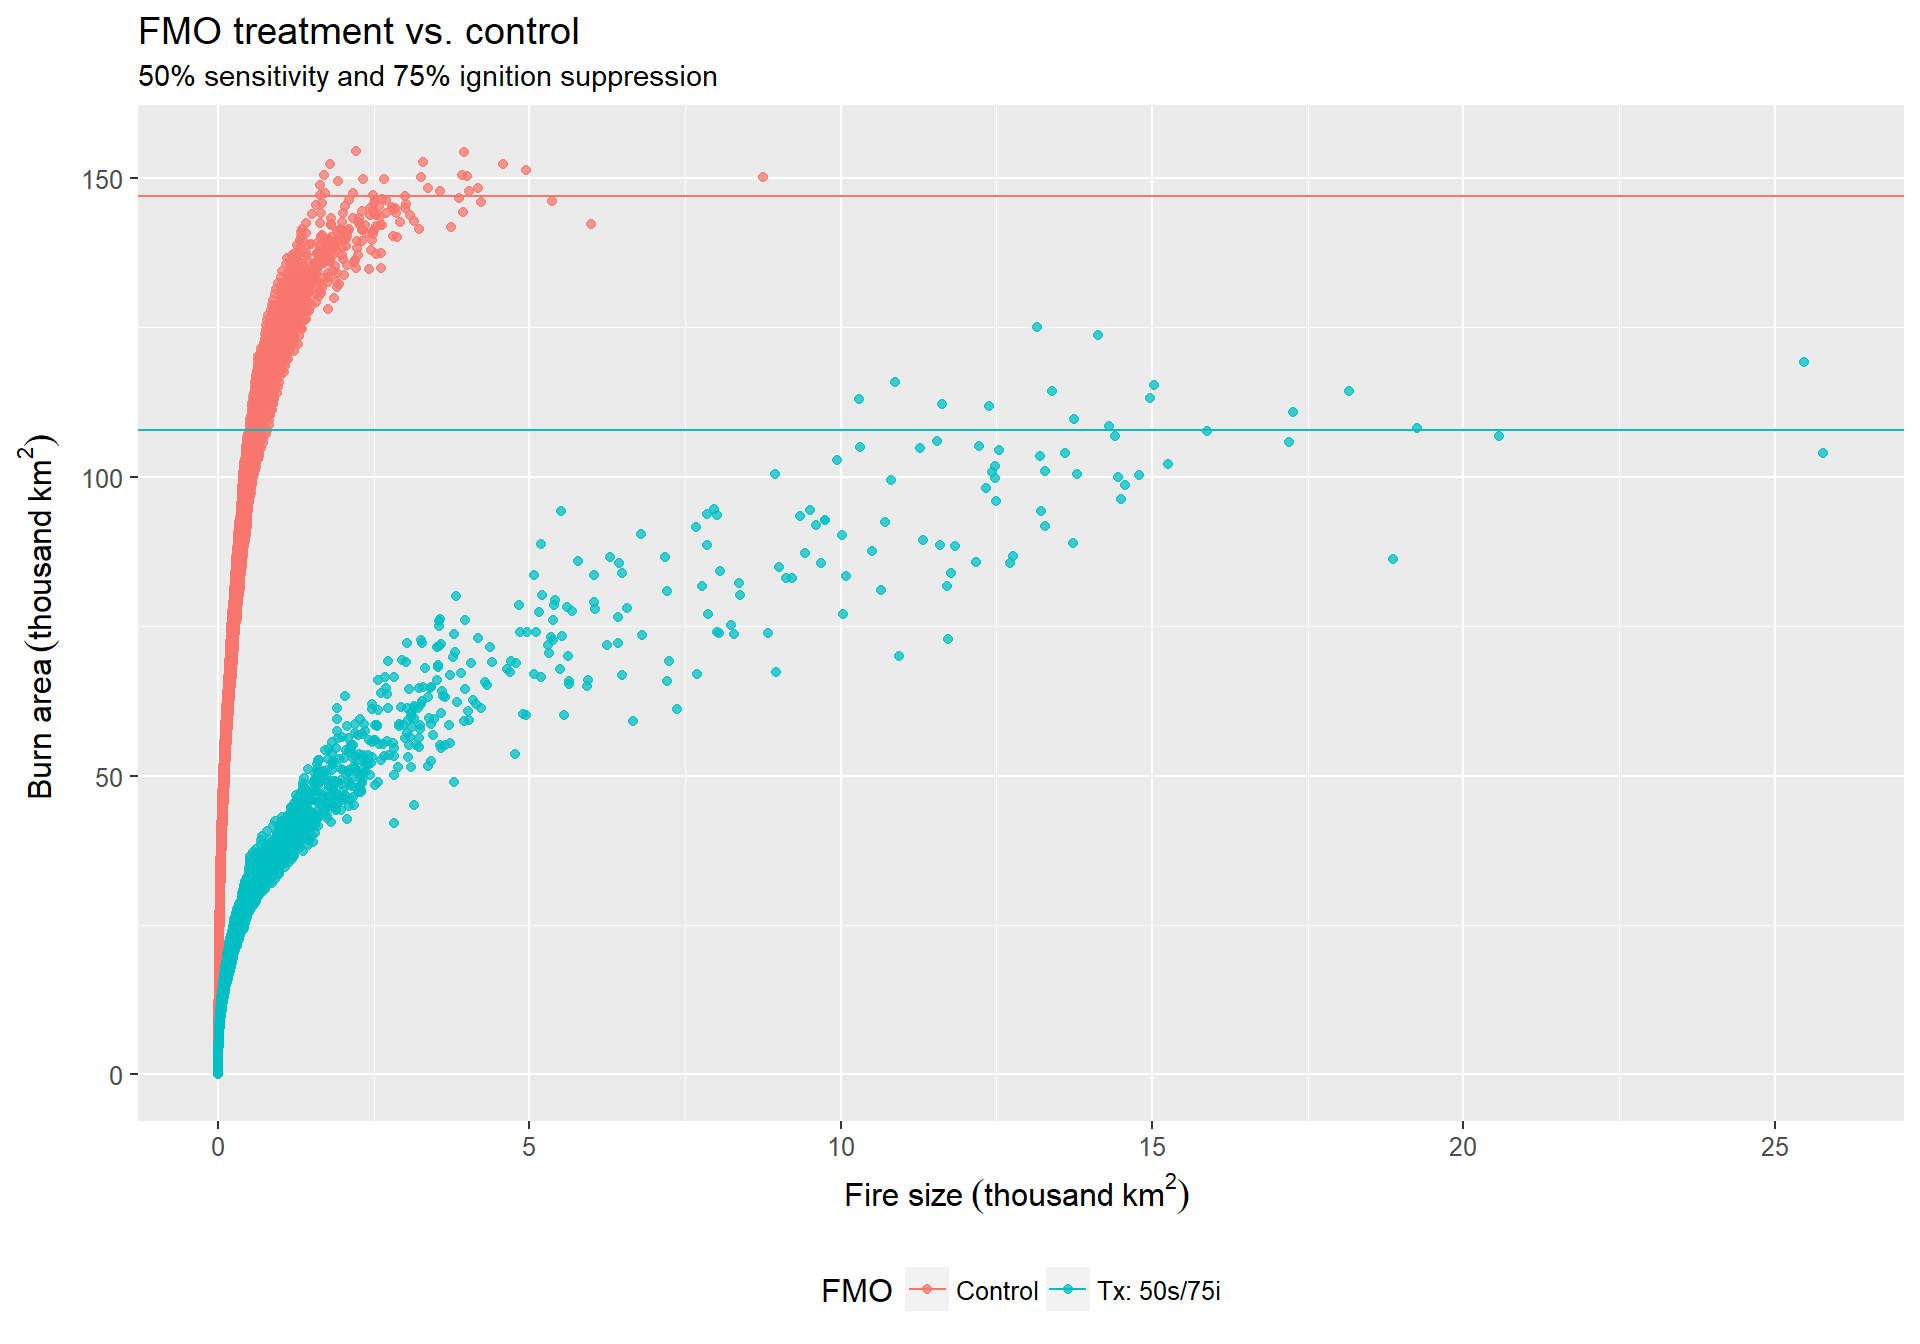
Figure 1. 1950 - 2013 cumulative burn vs. fire size.