snapflex provides functions and templates for generating local flexdashboards showcasing and summarizing SNAP data sets as well as functions for accessing existing popular SNAP flexdashboards hosted online.
Available templates
Before creating flexdashboards for SNAP climate data, it is necessary to know what flexdashboard templates are available. This can be done with flex_templates.
library(snapflex)
flex_templates()
#> # A tibble: 2 x 7
#>   id    description            variable      deltas period    shiny params
#>   <chr> <chr>                  <chr>         <lgl>  <chr>     <lgl> <lgl>
#> 1 psc1  projected seasonal cl~ temperature ~ TRUE   seasonal~ FALSE TRUE
#> 2 rsds1 projected RSDS exampl~ rsds          FALSE  annual, ~ FALSE TRUE
The package is in early development so the list is scant at the moment.
The table displays useful information about each template:
- the template ID used for generating a local flexdashboard.
- a brief description of the template.
- the variables included in the flexdashboard.
- whether any variables are displayed as deltas in comparison to a baseline rather than as raw values.
- intra- and/or inter-annual time period information if applicable.
- whether Shiny is used at runtime to launch a local instance of an interactive flexdashboard rather than a standalone html document.
- whether the template requires any additional parameters specified by the user.
User specifications
Regarding the last item on the above list, templates allow limited user customization. For example, all templates allow global plot settings for the plot theme and font attributes to be changed from their template-specific defaults via snaptheme, gfont, regular and bold. gfont sets the Google font and regular and bold take numeric weights.
Beyond these general optional parameters, each template may require additional unique parameters. These cannot be ignored like the optional ones. They do not have default settings and rely on the user to choose their values. For example, a flexdashboard template for climate trends at a point location may require the user to provide a specific location from a list of available options so that the template can be used for more than a single, hard-coded location. The row in flex_templates() pertaining to the psc1 template for projected seasonal climate at a point location shows TRUE under the params column. This means that this template requires user-specified parameters. It would show FALSE if only optional parameters were available. Use flex_params with the template ID to see what is required.
flex_params(template = "psc1")
#> # A tibble: 5 x 3
#>   parameter value     hint
#>   <chr>     <chr>     <chr>
#> 1 location  <NA>      See snaplocs::locs for valid point location names.
#> 2 gfont     Play      A valid Google Fonts name. See https://fonts.google~
#> 3 regular   400       Regular Google font weight.
#> 4 bold      400       Bold Google font weight.
#> 5 snaptheme theme_sn~ A ggplot theme from the snapplot package, e.g., 'th~
flex_params returns a data frame as above for any given template ID. The first column gives parameter names. The second gives their default values. If NA, it is a required parameter and must be provided by the user when rendering a flexdashboard template. In this case there is only one required parameter: location. Having this information makes it possible to now use this template with flex, which returns an error if any required parameter is not provided. The third column show hints that provide some context or description of what is considered a valid value for each parameter in case you are not familiar with the underlying SNAP data or flexdashboard template.
Creating flexdashboards
The central function in snapflex that creates and populates flexdashboards from templates and SNAP climate data sets is flex. Specify out_dir in flex if you want to save flexdashboards somewhere other than your working directory.
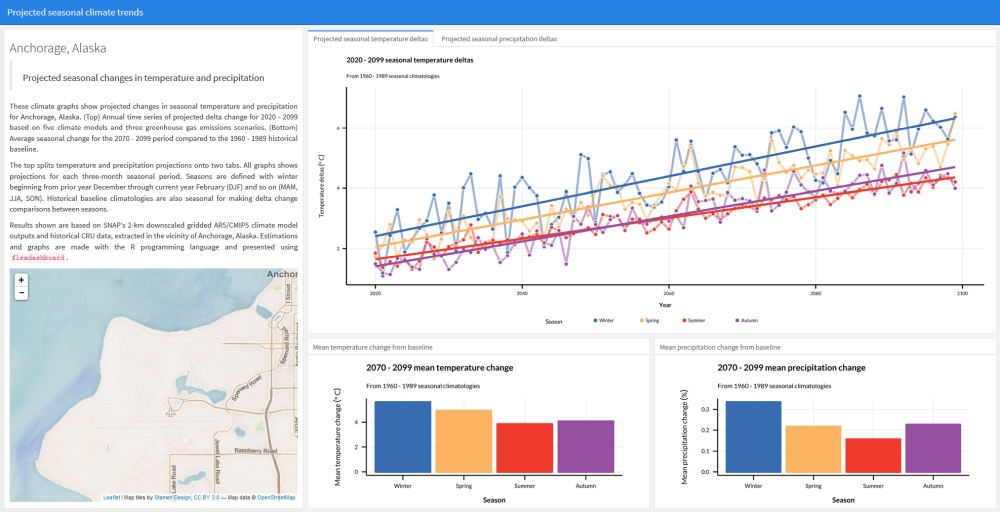
pars <- list(location = "Anchorage")
flex(template = "psc1", template_params = pars)
#> Genrating flexdashboard...
#> Dashboard complete.
This will create a flexdashboard using rmarkdown and save it to out_dir. Click the image to view the flexdashboard result.
Some templates use Shiny runtime and launch in your web browser as an app. For these templates, there is no static HTML document saved to out_dir.
Remember that snapflex is part of the SNAPverse. It is for showcasing SNAP data sets. If using snapflex it is important to have a more general familiarity with the SNAPverse. Specifically, it is important in the example above to know that available point locations associated with SNAP climate data are part of the snaplocs package. flex_params provides this hint, but generally speaking, success using SNAPverse packages correlates with the level of familiarity you have with the verse and the SNAP data sets it wraps around.
Optional parameters
Recreating the above dashboard using different values for optional parameters can be done like in the following example.
pars <- list(location = "Anchorage", gfont = "Source Sans Pro", regular = 300,
    bold = 400, snaptheme = "theme_snapdark")
flex(template = "psc1", template_params = pars)
flex_dashboard arguments
The ... argument can be used to pass a list of arguments directly to flexdashboard::flex_dashboard for additional control over the structure and appearance of template output. Common arguments include theme, css and storyboard. See the flexdashboard package for more information.
Storyboards
Any template can be alternatively rendered as a storyboard-style flexdashboard. However, not all templates are intended for use this way, so mileage may vary. Some templates are dual-designed to support both formats. For example, the rsds1 template provides four plots in a standard layout which little additional information. This is useful if you already know what you are looking at. If storyboard = TRUE, the template will be rendered to a storyboard. This provides additional textual summaries for each plot that are not part of the standard, simplified layout. It also allows for larger display of individual plots.